Site Speed
What is page speed — and why does Google care about it?
Page speed is one of those things everyone knows matters but few people actually understand. Here's a straightforward explanation — no developer experience needed.
See how fast (or slow) your site really is — free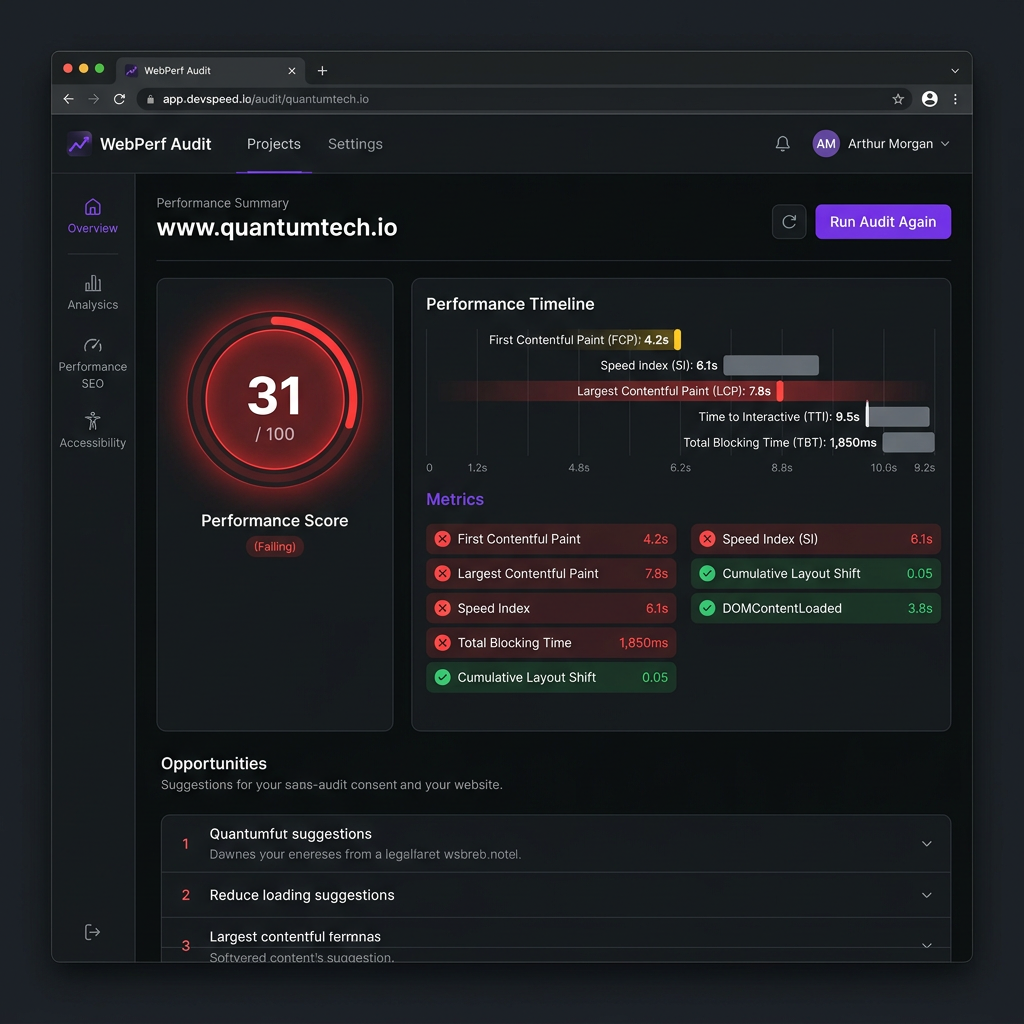
What page speed actually means
Page speed isn't a single number — it's a collection of measurements that together describe how quickly your website loads and becomes usable. When someone types your URL into a browser and hits enter, the clock starts. Page speed measures how quickly different milestones happen: when the first bit of content appears, when the main content loads, when the page becomes fully interactive.
Google uses these measurements to decide how to rank your site. A slow site doesn't just frustrate users — it actively gets pushed down the search results.
The four metrics Google actually measures
Largest Contentful Paint
How long until the main content of the page is visible
First Contentful Paint
How long until any content appears on screen
Cumulative Layout Shift
How much the page "jumps around" as it loads
Total Blocking Time
How long the page is unresponsive to clicks or taps
Failing any of these? Find out now.
Velrix runs a real Lighthouse test on your site in seconds.
The most common reasons sites are slow
Unoptimised images
A single high-resolution photo can be 4–8MB. Multiply that by 10 images on a page and you've got a site that takes 6–8 seconds to load on a standard mobile connection. The fix is simple — compress and resize images before uploading — but most websites skip this step entirely.
Render-blocking scripts
When a browser loads your page, it reads the code top to bottom. If it hits a large JavaScript or CSS file before the main content, it stops and waits. This is called "render blocking" and it's one of the most common causes of slow-feeling pages. The user sees a blank screen while the browser does invisible work.
No caching set up
Every time a user visits a page, their browser downloads all the files that make it up. With proper caching, returning visitors can load from a local copy instead — making the page feel almost instant. Without it, every visit starts from scratch. This is a server-level setting most sites never configure.
Too many third-party scripts
Every analytics tag, chat widget, ad pixel, and social button you add to your site loads its own external script. Some of these add 200–400ms of delay each. A site with five or six of these running on every page is often slower not because of the site itself, but because of all the extras layered on top.
How fast is your site actually loading?
The only way to know for sure is to test it. Velrix runs a real Lighthouse analysis on your site and shows you exactly which speed metrics you're passing and failing — in plain English, not developer jargon.
You'll see your performance score, which specific metrics are failing, and what's causing the slowdown — so you can tell a developer exactly what to fix, or fix it yourself if it's something simple.
Get my real speed score — takes 30 seconds